Creating QML Controls From Scratch: LineChart

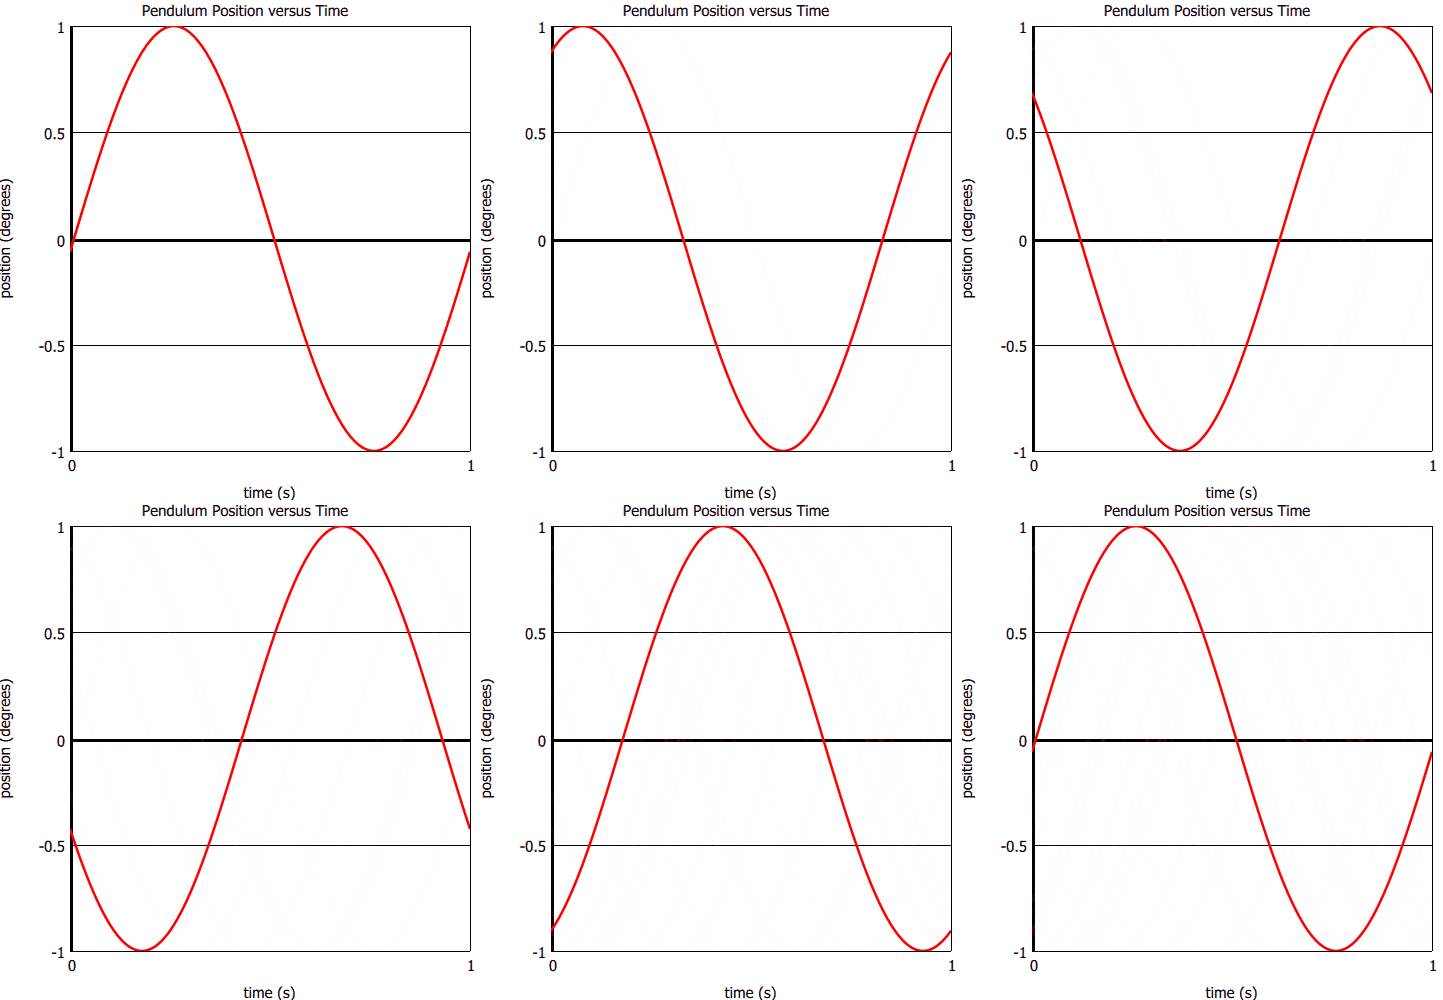
Continuing our QML Controls from Scratch series, this time we will implement a LineChart. LineChart is similar to BarChart but with two exceptions: (1) it requires x axis tick marks and (2) it uses Canvas to draw the line curve. This is our first control to use Canvas, which is a rectangular area on which to draw with a Context2D. The public interface consists of a title, yLabel, xLabel, a list of points, and the color of the line.
Note: If using Qt 4 and/or QtQuick 1, replace Canvas either by a custom QDeclarativeItem or an Image fed by a QDeclarativeImageProvider.
LineChart.qml
import QtQuick 2.0

Item {
    id: root

 // public
    property string title:  'title'
    property string yLabel: 'yLabel'
    property string xLabel: 'xLabel'

    property variant points: []//{x: 0, y: 0}, {x: 1, y: 2}]
    property string  color: 'red'

 // private
    property double factor: Math.min(width, height)

    property double yInterval:  1 // set by onPointsChanged
    property double yMaximum:  10
    property double yMinimum:   0
    function toYPixels(y){return -plot.height / (yMaximum - yMinimum) * (y - yMinimum) + plot.height}

    property double xInterval:  1 // set by onPointsChanged
    property double xMaximum:  10
    property double xMinimum:   0
    function toXPixels(x){return plot.width  / (xMaximum - xMinimum) * (x - xMinimum)}

    onPointsChanged: { // auto scale
        var xMinimum = 0, xMaximum = 0, yMinimum = 0, yMaximum = 0
        for(var i = 0; i < points.length; i++) {
            if(points[i].y > yMaximum)  yMaximum = points[i].y
            if(points[i].y < yMinimum)  yMinimum = points[i].y
            if(points[i].x > xMaximum)  xMaximum = points[i].x
            if(points[i].x < xMinimum)  xMinimum = points[i].x
        }

        var yLog10     = Math.log(yMaximum - yMinimum) / Math.LN10 //  take log, convert to integer, and then raise 10 to this power
        root.yInterval = Math.pow(10, Math.floor(yLog10)) / 2 // distance between ticks
        root.yMaximum  = Math.ceil( yMaximum / yInterval) * yInterval
        root.yMinimum  = Math.floor(yMinimum / yInterval) * yInterval

        var xLog10     = Math.log(xMaximum - xMinimum) / Math.LN10 //  take log, convert to integer, and then raise 10 to this power
        root.xInterval = Math.pow(10, Math.floor(xLog10)) // distance between ticks
        root.xMaximum  = Math.ceil( xMaximum / xInterval) * xInterval
        root.xMinimum  = Math.floor(xMinimum / xInterval) * xInterval

        canvas.requestPaint()
    }

    width: 500;  height: 500 // default size

    Text { // title
        text: title
        anchors.horizontalCenter: parent.horizontalCenter
        font.pixelSize: 0.03 * factor
    }

    Text { // y label
        text: yLabel
        font.pixelSize: 0.03 * factor
        y: 0.5 * (2 * plot.y + plot.height + width)
        rotation: -90
        transformOrigin: Item.TopLeft
    }

    Text { // x label
        text: xLabel
        font.pixelSize: 0.03 * factor
        anchors{bottom: parent.bottom;  horizontalCenter: plot.horizontalCenter}
    }

    Item { // plot
        id: plot

        anchors{fill: parent;  topMargin: 0.05 * factor;  bottomMargin: 0.1 * factor;  leftMargin: 0.15 * factor;  rightMargin: 0.05 * factor}

        Repeater { // y axis tick marks and labels
            model: Math.floor((yMaximum - yMinimum) / yInterval) + 1 // number of tick marks

            delegate: Rectangle {
                property double value: index * yInterval + yMinimum
                y: toYPixels(value)
                width: plot.width;  height: value? 1: 3
                color: 'black'

                Text {
                    text: parseFloat(parent.value.toPrecision(9)).toString()
                    anchors{right: parent.left;  verticalCenter: parent.verticalCenter;  margins: 0.01 * factor}
                    font.pixelSize: 0.03 * factor
                }
            }
        }

        Repeater { // x axis tick marks and labels
            model: Math.floor((xMaximum - xMinimum) / xInterval) + 1 // number of tick marks

            delegate: Rectangle {
                property double value: index * xInterval + xMinimum
                x: toXPixels(value)
                width: value? 1: 3;  height: plot.height;
                color: 'black'

                Text {
                    text: parseFloat(parent.value.toPrecision(9)).toString()
                    anchors{top: parent.bottom;  horizontalCenter: parent.horizontalCenter;  margins: 0.01 * factor}
                    font.pixelSize: 0.03 * factor
                }
            }
        }

        Canvas { // points
            id: canvas

            anchors.fill: parent

            onPaint: {
                var context = getContext("2d")
                context.clearRect(0, 0, width, height) // new points data (animation)
                context.strokeStyle = color
                context.lineWidth   = 0.005 * factor
                context.beginPath()
                for(var i = 0; i < points.length; i++)
                    context.lineTo(toXPixels(points[i].x), toYPixels(points[i].y))
                context.stroke()
            }
        }
    }

//    focus: true
//    Keys.onPressed: { // increase values with 0-9 and decrease with Alt+0-9
//        if(!isNaN(parseInt(event.text))  &&  parseInt(event.text) < root.points.length) { // 0-9 keys
//            var points = root.points
//            points[event.text].y = points[event.text].y + (event.modifiers? -0.1: 0.1) * (yMaximum - yMinimum)
//            root.points = points
//        }
//    }

//    Component.onCompleted: { // sine wave
//        var points = [], N = 100, T = 1
//        for(var i = 0; i <= N; i++)
//            points.push({x: T / N * i , y: Math.sin(2 * Math.PI * i / N)})
//        root.points = points
//    }
}
Test.qml
import QtQuick 2.0

LineChart {
    title:  'Pendulum Position versus Time'
    yLabel: 'position (degrees)'
    xLabel: 'time (s)'
    color:  'red'

    Component.onCompleted: { // sine wave
        var positions = [], N = 100, T = 1
        for(var i = 0; i <= N; i++)
            positions.push({x: T / N * i , y: Math.sin(2 * Math.PI * i / N)})
        points = positions
    }
}
Summary
In this post, we created a LineChart. Next time we'll create a PieChart. The source code can be downloaded here. Click here to access the whole series.