A Look at Tracing Tools
Continuing our Qt Developer's Bag of Tricks series, this time I'll give you an overview of some applications that come under the general category of tracing. (I'll also include some test coverage tools here too since they don't fit in any other categories in this blog series.)
Tracing is often an effective and efficient debugging technique that doesn't require as much effort as using a debugger. It can be particularly useful for programs that you didn't write and don't have source code for. If a program crashes or hangs, tracing it may quickly identify the cause of the problem.
Strace
Strace is a standard Linux and Unix tool for tracing system calls and signals, and has been around for ages. Typically it is used to run a specified command until it exits. It intercepts and reports the system calls, which are invoked by the process and any signals that are received. The name of each system call, its arguments and return value are displayed in the output.
Here is a portion of the strace output when running the spreadsheet example program that I have been using throughout this series:
% strace ./spreadsheet
execve("./spreadsheet", ["./spreadsheet"], [/* 64 vars */]) = 0
brk(NULL)                               = 0x5610b856a000
access("/etc/ld.so.nohwcap", F_OK)      = -1 ENOENT (No such file or directory)
mmap(NULL, 12288, PROT_READ|PROT_WRITE, MAP_PRIVATE|MAP_ANONYMOUS, -1, 0) = 0x7f7b342e8000
access("/etc/ld.so.preload", R_OK)      = -1 ENOENT (No such file or directory)
open("/usr/local/Qt-5.9.1/lib/tls/x86_64/libQt5Widgets.so.5", O_RDONLY|O_CLOEXEC) = -1 ENOENT (No such file or directory)
stat("/usr/local/Qt-5.9.1/lib/tls/x86_64", 0x7ffcbd2c7ce0) = -1 ENOENT (No such file or directory)
open("/usr/local/Qt-5.9.1/lib/tls/libQt5Widgets.so.5", O_RDONLY|O_CLOEXEC) = -1 ENOENT (No such file or directory)
stat("/usr/local/Qt-5.9.1/lib/tls", 0x7ffcbd2c7ce0) = -1 ENOENT (No such file or directory)
open("/usr/local/Qt-5.9.1/lib/x86_64/libQt5Widgets.so.5", O_RDONLY|O_CLOEXEC) = -1 ENOENT (No such file or directory)
stat("/usr/local/Qt-5.9.1/lib/x86_64", 0x7ffcbd2c7ce0) = -1 ENOENT (No such file or directory)
open("/usr/local/Qt-5.9.1/lib/libQt5Widgets.so.5", O_RDONLY|O_CLOEXEC) = 3
read(3, "\177ELF\2\1\1\0\0\0\0\0\0\0\0\0\3\0>\0\1\0\0\0\0\0\0\0\0\0\0\0"..., 832) = 832
fstat(3, {st_mode=S_IFREG|0755, st_size=6681456, ...}) = 0
mmap(NULL, 6684778, PROT_READ|PROT_EXEC, MAP_PRIVATE|MAP_DENYWRITE, 3, 0) = 0x7f7b33a65000
mprotect(0x7f7b34092000, 4096, PROT_NONE) = 0
poll([{fd=3, events=POLLIN}], 1, -1)    = 1 ([{fd=3, revents=POLLIN}])
recvmsg(3, {msg_name(0)=NULL, msg_iov(1)=[{"\1\1\4\2\0\0\0\0\6\0@\3\0\0\0\0\0\0\0\0\0\0\0\0\0\0\0\0\0\0\0\0", 4096}], msg_controllen=0, msg_flags=0}, 0) = 32
getpid()                                = 16955
shutdown(3, SHUT_RDWR)                  = 0
close(3)                                = 0
write(8, "\1\0\0\0\0\0\0\0", 8)         = 8
futex(0x5610b86b918c, FUTEX_WAIT_PRIVATE, 1, NULL) = 0
futex(0x5610b86b9160, FUTEX_WAKE_PRIVATE, 1) = 0
close(7)                                = 0
munmap(0x7f7b28c8c000, 146956)          = 0
getpid()                                = 16955
getpid()                                = 16955
exit_group(0)                           = ?
+++ exited with 0 +++
The command supports many options, which are documented in the man page. A couple that I use regularly are the -o option to redirect output to a file (allowing you to save and study the output later. It also typically allows the command to run faster), and the -f or follow option which causes strace to trace any child processes which are created as a result of the fork, vfork or clone system calls.
Ltrace
Strace is limited to tracing system calls into the Linux kernel, which restricts your ability to see what it is doing internally. The ltrace program intercepts and reports on the dynamic library calls, which are called by the executed process. It can also intercept and print the system calls and signals received. Its usage is very similar to strace.
Typically you will want to specify a filter for the library calls to trace. Here is an example of tracing the calls into the Qt5Core library:
% ltrace -e '@libQt5Core.so*' ./spreadsheet

libQt5Core.so.5->pthread_self(0x7f3f177b0b50, 0x5633c42a5240, 0, 0x5633c42a5420) = 0x7f3f18598740
libQt5Core.so.5->_Znwm(40, 0x5633c42a5240, 0x5633c532a500, 0x5633c42a5420) = 0x5633c5329f30
libQt5Core.so.5->geteuid()                       = 1000
libQt5Core.so.5->getuid()                        = 1000
libQt5Core.so.5->__tls_get_addr(0x7f3f177ae7c8, 0x50901, 0x7ffc09ef6738, 0x7f3f169c61a7) = 0x7f3f18598730
libQt5Core.so.5->_Znwm(120, 0, 0x7f3f185dc948, 1) = 0x5633c532aae0
libQt5Core.so.5->__tls_get_addr(0x7f3f177ae7c8, 0, 0x5633c532aae0, 0x7f3f16cb9b00) = 0x7f3f18598730
libQt5Core.so.5->pthread_once(0x7f3f177b0730, 0x7f3f1730b9f0, 0x5633c532aae0, 0x7f3f16cb9b00 <unfinished ...>
libQt5Core.so.5->pthread_key_create(0x7f3f177b072c, 0x7f3f1730bed0, 0x7f3f177b0730, 0x7f3f16cb9b00) = 0
<... pthread_once resumed> )                     = 0
libQt5Core.so.5->pthread_setspecific(4, 0x5633c532aae0, 0x7fffffff, 0x7f3f166e8c80) = 0
A handy feature is the -C option which will demangle C++ method names. This is useful when using C++-based libraries like Qt. Here is an example:
% ltrace -e '@libQt5Widgets.so*' -C ./spreadsheet

libQt5Widgets.so.5->operator new(unsigned long)(360, 0x7ffe8ea1e72c, 0x7ffe8ea1e9b8, 0x50901) = 0x55ad14885970
libQt5Widgets.so.5->QGuiApplicationPrivate::QGuiApplicationPrivate(int&, char**, int)(0x55ad14885970, 0x7ffe8ea1e72c, 0x7ffe8ea1e9b8, 0x50901) = 0x7f75209e4168
libQt5Widgets.so.5->QGuiApplication::QGuiApplication(QGuiApplicationPrivate&)(0x7ffe8ea1e730, 0x55ad14885970, 0, 0) = 0x7f75209d4148
libQt5Widgets.so.5->QGuiApplicationPrivate::init()(0x55ad14885970, 0x7f752122e050, 0, 0 <unfinished ...>
libQt5Widgets.so.5->QGuiApplicationPrivate::createEventDispatcher()(0x55ad14885970, 0x7f751f94eb30, 0x7f7520181800, 0) = 0x55ad148c3f60
libQt5Widgets.so.5->QCoreApplicationPrivate::threadRequiresCoreApplication()(0x55ad14885970, 0x7ffe8ea1e730, 0x7ffe8ea1e4f0, 0x7f7520b4b780) = 1
libQt5Widgets.so.5->QCoreApplicationPrivate::mainThread()(1, 0x7f752122e050, 0, 0x7f752122d730) = 0x55ad14885b60
libQt5Widgets.so.5->QCoreApplicationPrivate::sendThroughApplicationEventFilters(QObject*, QEvent*)(0x55ad14885970, 0x7ffe8ea1e730, 0x7ffe8ea1e4f0, 0x7f752122d730) = 0
libQt5Widgets.so.5->QCoreApplicationPrivate::sendThroughObjectEventFilters(QObject*, QEvent*)(0x7ffe8ea1e730, 0x7ffe8ea1e4f0, 0x7ffe8ea1e4f0, 0x7f752122d730) = 0
libQt5Widgets.so.5->QGuiApplication::event(QEvent*)(0x7ffe8ea1e730, 0x7ffe8ea1e4f0, 68, 0x7f752122d730) = 1
libQt5Widgets.so.5->QCoreApplicationPrivate::threadRequiresCoreApplication()(0x55ad14885970, 0x55ad148d0da0, 0x7ffe8ea1e2f0, 0x7f7520b4b780) = 1
libQt5Widgets.so.5->QCoreApplicationPrivate::mainThread()(1, 0x7f752122e050, 0, 0x7f752122d730) = 0x55ad14885b60
libQt5Widgets.so.5->QCoreApplicationPrivate::sendThroughApplicationEventFilters(QObject*, QEvent*)(0x55ad14885970, 0x55ad148d0da0, 0x7ffe8ea1e2f0, 0x7f752122d730) = 0
libQt5Widgets.so.5->QCoreApplicationPrivate::sendThroughObjectEventFilters(QObject*, QEvent*)(0x55ad148d0da0, 0x7ffe8ea1e2f0, 0x7ffe8ea1e2f0, 0x7f752122d730) = 0
Opensnoop
An interesting tool I came across is opensnoop, part of a toolkit called BCC for creating kernel tracing and manipulation programs that includes several useful tools and examples. It makes use of extended Berkeley Packet Filters (eBPF), a feature of the Linux kernel since version 3.15.
Unlike the previous programs I mentioned, BCC is not typically included as a standard package in Linux distributions and you will need to either download packages from the project website or build it yourself from source code. I built it from source on an Ubuntu Linux system according to the build instructions.
Opensnoop monitors calls to the open() system call by any process on the system. It can be useful, for example, for discovering configuration and log files, if used during application startup. Here is some of the output when run for a seconds on an Ubuntu desktop system:
% sudo /usr/local/share/bcc/tools/opensnoop

PID    COMM               FD ERR PATH
1257   pool               12   0 /etc/services
1257   pool               12   0 /etc/hosts
1525   gnome-software     15   0 /etc/localtime
1      systemd            19   0 /proc/247/cgroup
743    NetworkManager     21   0 /var/lib/NetworkManager/secret_key
743    NetworkManager     21   0 /proc/sys/net/ipv6/conf/wls1/mtu
1525   gnome-software     15   0 /etc/localtime
1257   pool               12   0 /etc/services
1257   pool               12   0 /etc/hosts
743    NetworkManager     21   0 /var/lib/NetworkManager/secret_key
743    NetworkManager     21   0 /proc/sys/net/ipv6/conf/wls1/mtu
1525   gnome-software     15   0 /etc/localtime
1257   pool               12   0 /etc/services
1257   pool               12   0 /etc/hosts
925    irqbalance          3   0 /proc/interrupts
925    irqbalance          3   0 /proc/stat
925    irqbalance          3   0 /proc/irq/28/smp_affinity
925    irqbalance          3   0 /proc/irq/18/smp_affinity
925    irqbalance          3   0 /proc/irq/19/smp_affinity
The BCC tookit includes many other tools besides opensnoop, but I haven't had time yet to explore them.
Valgrind Lackey
Lackey is one of the tools that is part of the Valgrind suite. It performs various kinds of basic program measurement. While it is primarily intended as an example tool, it can be useful for programming. It has a number of options that control the output it produces. Here is an example with the default settings:
% valgrind --tool=lackey ./spreadsheet

==21425== Lackey, an example Valgrind tool
==21425== Copyright (C) 2002-2015, and GNU GPL d, by Nicholas Nethercote.
==21425== Using Valgrind-3.12.0 and LibVEX; rerun with -h for copyright info
==21425== Command: ./spreadsheet
==21425==
==21425==
==21425== Counted 1 call to main()
==21425==
==21425== Jccs:
==21425==   total:         87,766,580
==21425==   taken:         53,065,907 (60%)
==21425==
==21425== Executed:
==21425==   SBs entered:   66,992,541
==21425==   SBs completed: 43,597,395
==21425==   guest instrs:  382,321,105
==21425==   IRStmts:       2,485,173,404
==21425==
==21425== Ratios:
==21425==   guest instrs : SB entered  = 57 : 10
==21425==        IRStmts : SB entered  = 370 : 10
==21425==        IRStmts : guest instr = 65 : 10
==21425==
==21425== Exit code:       0
Gcov et al.
Similar to the support for profiling that we discussed in the last part of this series, the GNU compiler has support for measuring test coverage when programs are executed. It is often important to know how much of a program has been exercised during testing, typically unit testing. This is a requirement for complying with certain medical device standards, for example.
Gcc does this using compile options, as well as some external programs that analyze the data collected. The compile option is -coverage, and is also needed when linking. The external programs typically used for analyzing test coverage include gcov, lcov, genhtml, geninfo, lcovrc, genpng, and gendesc. You can consult the documentation for these programs to learn more.
For my example using a Qt-based spreadsheet program, I followed these steps to generate a make file with suitable compile and link options, build the program, and then run it:
% qmake QMAKE_CXXFLAGS+=--coverage QMAKE_LFLAGS+=--coverage
% make
% ./spreadsheet
On exit, it generates a number of .gcda and .gcno files with test coverage information. We can analyze the results and see them in a web-based report showing line, function, and branch coverage both overall, as well as down to the source code line level, including annotated source files. These were the commands I ran to do this:
% lcov -rc lcov_branch_coverage=1 --no-external --capture --directory . --output-file coverage.info
% genhtml -rc lcov_branch_coverage=1 --output-directory coverage coverage.info
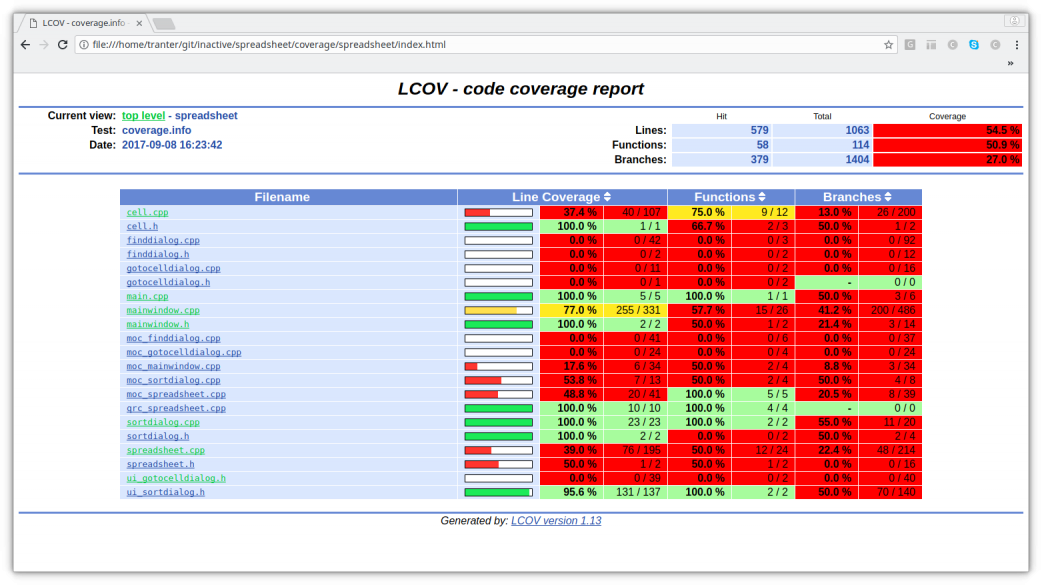
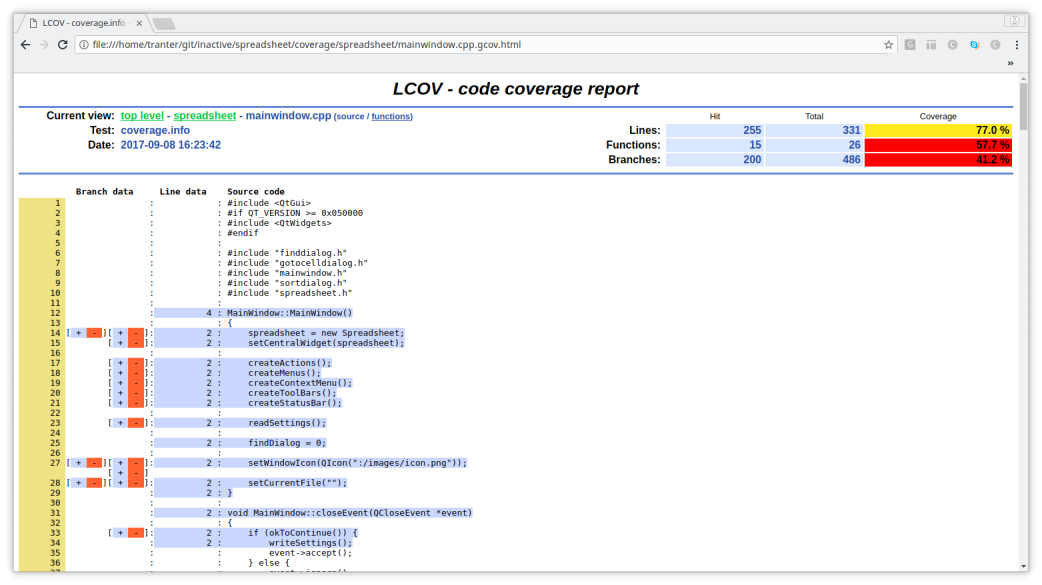
Here are some screen shots of the results being shown in a web browser:


The first summary screens shows the line, function, and branch coverage overall and on a per-file basis. The second screen shows annotated source code for the file mainwindow.cpp, indicated lines and branches were and were not executed.
Many other free and commercial test coverage tools exist. A good cross-platform, cross-language, cross-compiler solution that works well with Qt is the Coco (3) tool from frogLogic, the same company that offers the SQUISH automated test tool.
Summary
I hope you will consider using tracing as a debug technique, and explore some of the tools I mentioned here. In the next installment I'll explore some utilities for tracking down memory and resource leaks, a particularly nasty and difficult type of problem to solve.