
Using Google Analytics to Monitor Qt Applications
There is often a desire of some companies to monitor usage of specific software applications to improve business over time. Reports and dashboards that provide visual representations of usage data can be used to inform product development, establish product value and influence business strategy. Google Analytics (GA), while originally intended for web analytics, offers a number of advantages as a framework for monitoring products with the use of Qt-based applications.
Google Analytics event tracking features are sufficiently flexible to capture usage information for most applications. Deciding which events will be tracked, how fields will be set and defining additional information needed for reporting requires skill, careful thought and likely, a few iterations.
When ICS began to deploy the Qt based ViewPoint Kiosk to auto dealer showrooms, the team knew that monitoring kiosk performance and tracking user activity would be central to the product’s success. Early on, we would use dashboards to report on system status and to identify and solve problems right away.
Production systems were designed to provide valuable information about how people used the kiosk while in the showroom. For example, the system would collect information on which videos consumers watched or what was the last page they viewed. This data would help us improve the user experience for ViewPoint users in the future. Customers also wanted usage reports to guide content placement decisions and help provide a positive customer experience.
To implement Google Analytics for the ViewPoint Kiosk, we followed these steps:
- Identify which events should be tracked
- For each tracked event, specify how each of the event tracking dimensions and metrics would be set
- Identify any custom dimensions and metrics needed
Identify Which Events Should Be Tracked
Once you identify which dashboards and/or reports you will need for the first phase, it will help focus your efforts and reduce re-work. We identified the events to track for ViewPoint by going through the application and making note of data that would be useful to know. In retrospect, it would have been valuable for the product team to generate a rough draft of the reports needed for the first release.
Specify Event Tracking Dimensions and Metrics
Each Google Analytics event consists of four values: the category, action, label and value. For example, if the user viewed the video “intro-cherokee.mp4,” the application would pass the ga function then send a command with the event hit type as follows:
ga('send', 'event', 'asset', 'view', 'path/intro-cherokee.mp4');
The Google Analytics event tracking API is flexible, which is important. However, with flexibility comes the complexity of choosing among different potential approaches to mapping the event information onto the Google Analytics event parameters. For example, in our initial implementation, if someone viewed an image asset it would generate two events:
ga('send', 'event', 'jeep.xml', 'open-asset', 'path/image.jpg');
ga('send', 'event', 'jeep.xml', 'close-asset', 'path/image.jpg');
Using this approach, if we wanted to find out how long an asset was viewed, we would have to somehow pair the ‘open’ and ‘close’ events and calculate the difference. That would certainly be possible, but it sounded too complicated. We decided what we really wanted to track was precisely when and for how long an image asset was viewed. We decided to track the ‘image-view’ event and capture the elapsed time between when the image was opened and closed.
Identify Any Custom Dimensions and Metrics Needed
We also took advantage of the Google Analytics custom dimensions feature to store the presentation name, which freed up the ‘category’ parameter. This allowed us to track the same event using this function, which is not only simpler but also much more informative:
ga('send', 'event', 'asset', 'view', 'path/image.jpg', elapsed_time);
Using the Data
Once the events were set to be tracked in the kiosk application, the Google Analytics web interface provided basic reports and allowed us to create custom reports and dashboards. Our decision to use GA for event tracking has worked well. The implementation was straightforward and the data we need to support product development and sales is currently being captured.
We have discovered the GA reporting functions for applications like ViewPoint that rely heavily on event tracking, are limited, particularly with regard to events tracked in real time. Fortunately, there are many options to address reporting needs not supported by the Google Analytics web interface, including using the Google Analytics API as well as using third-party tools, like Klipfolio, that can use Google Analytics as an information source.
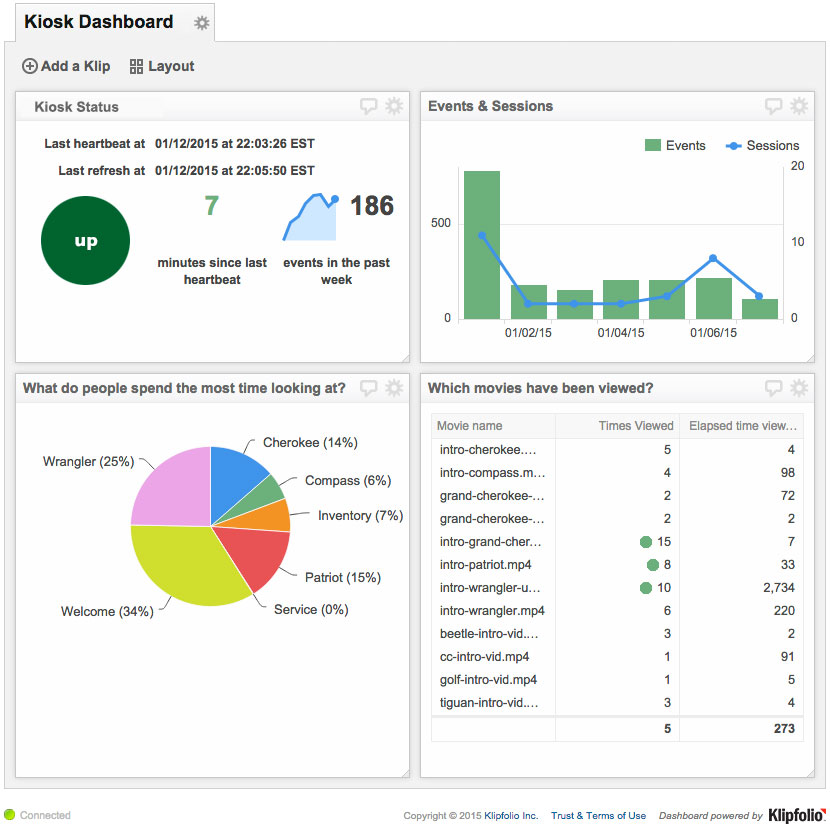
This dashboard, built using Klipfolio, shows kiosk status as well as user activity, including detailed information about what products they are learning about and which assets they've viewed:
In a future blog post we plan to show how Qt makes it easy to send events from an application to Google Analytics using Qt's networking APIs, including the source code for an example application.
References
- ViewPoint kiosks, website, last accessed January 9 2015, http://www.viewpointkiosks.com/
- Google Analytics Event Tracking - Web Tracking, website, last accessed January 9 2015, https://developers.google.com/analytics/devguides/collection/analyticsjs/events